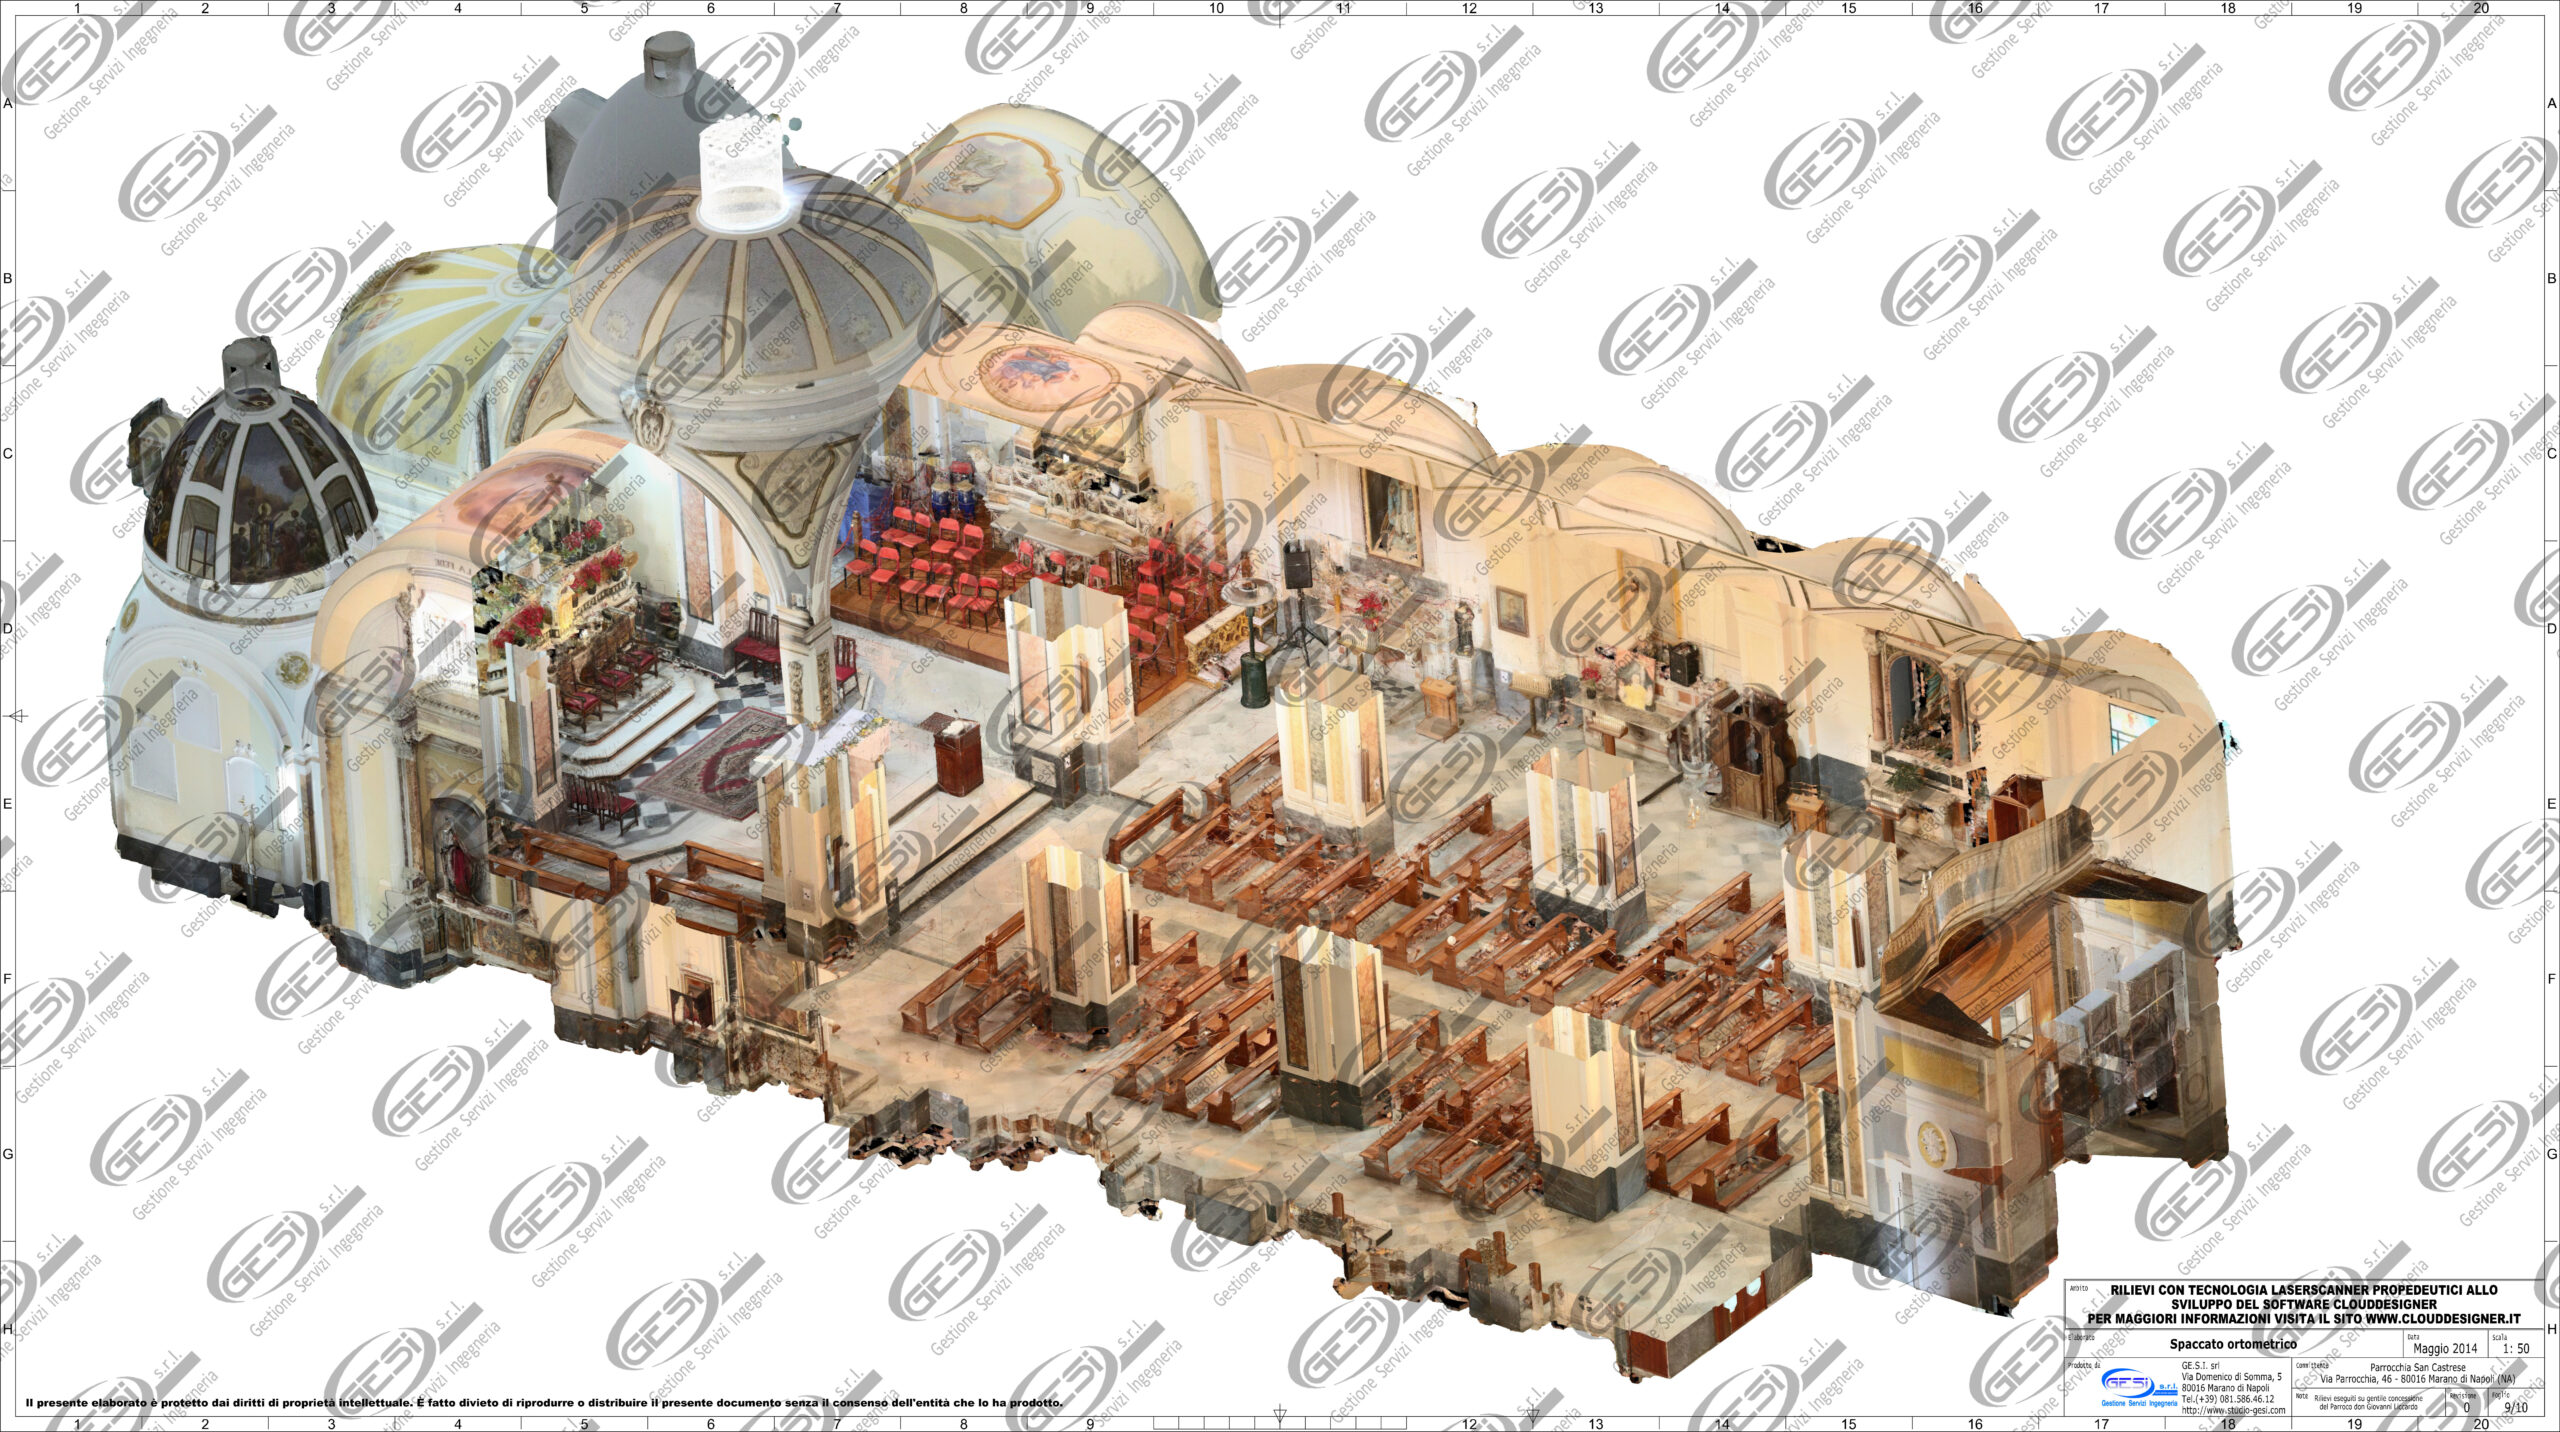
Laser Scanner surveys generate scenes that are built with constant angular resolution, therefore, the interspace between points on far surfaces (from the stationing) will be greater than the interspace between points on closer surfaces.

This phenomenon is difficult to observe from the 3D View by placing oneself in the center of the scene that is the position of the scanner, this phenomenon is instead very visible when looking at orthometric projections generated from planes placed in space. The interspace [i] is easily calculated as a function of the distance [d] and the number of columns [c] that form the scan rotation angle [c].
i=d·tan(2·c-1)
from which we can derive considerations on making orthometric projections on objects subfrontal to the observation station; these considerations have been resumed in the following table showing the relationship between interspace, observation distance, and resolution in Laser Scanner columns.
| c=5000 | c=10000 | c=20000 | c=40000 | |
| i [m] | d [m] | d [m] | d [m] | d [m] |
| 0,0001 | Ø | Ø | Ø | 1 |
| 0,0003 | Ø | Ø | 1 | 2 |
| 0,0006 | Ø | 1 | 2 | 4 |
| 0,0013 | 1 | 2 | 4 | 8 |
| 0,0025 | 2 | 4 | 8 | 16 |
| 0,0038 | 3 | 6 | 12 | 24 |
| 0,0050 | 4 | 8 | 16 | 32 |
| 0,0063 | 5 | 10 | 20 | 40 |
| 0,0100 | 8 | 16 | 32 | 64 |
| 0,0126 | 10 | 20 | 40 | 80 |
| 0,0188 | 15 | 30 | 60 | 120 |
| 0,0252 | 20 | 40 | 80 | 160 |
| 0,0314 | 25 | 50 | 100 | 200 |
| 0,0378 | 30 | 60 | 120 | 240 |
The symbol Ø means that it is not possible to obtain the interspace value wanted with the indicated resolution. The above table allows the choice of the interspatiality parameter [i] by observing the distance [d] to the objects.
This table can be a good guide to read just before starting a scan: it allows the on-the-spot adjustment of stationing position and horizontal resolution parameter [c].
With the data calculated so far it is still not possible to calculate the resolution [rp] of the photograph resulting from the orthogonal projection, which can be imagined to be strongly dependent on the interspace parameter. That resolution turns out such information is of considerable importance in the search for an acceptable quality value (it is believed that a tolerable value is ~200dpi). From the values of interspacing and print scale the perception of the solid texture of the scene is determined, think for example of spaces that look solid from a distance and one discovers spaced frames from very close up, a common example is the observation of a net from distance.
Recalling that resolution is a function of print scale [s] and is expressed in dots per inch (dpi), the result is the following
rp=s·2,54/i
from which the following tables linking resolution, scale of representation, and interspace can be developed.
The next table summarizes the resolution values for the 1:10 and 1:20 scales of representation useful for reproducing architectural and mechanical details.
| Scala 1:10 | Scala 1:20 | |
| rp [dpi] | i [m] | i [m] |
| ~850 | ~0,0003 | ~0,0001 |
| ~425 | ~0,0006 | ~0,0003 |
| ~200 | ~0,0012 | ~0,0006 |
Going further, the next table summarizes the resolution values for the 1:50, 1:100 and 1:200 scales of representation.
| Scala 1:50 | Scala 1:100 | Scala 1:200 | |
| rp [dpi] | i [m] | i [m] | i [m] |
| ~4200 | ~0,0003 | ~0,0005 | ~0,0010 |
| ~2000 | ~0,0005 | ~0,0010 | ~0,0025 |
| ~1000 | ~0,0010 | ~0,0025 | ~0,0050 |
| ~500 | ~0,0025 | ~0,0050 | ~0,0100 |
| ~250 | ~0,0050 | ~0,0100 | ~0,0200 |
Once the consistency of the above tables has been verified, this study can be generalized into the following tables that have a practical impact on the planning carried out by the surveyor.
The following table contains the maximum distance that satisfies in one shot: composed of representation scale, resolution and scan resolution.
| Scala | rp [dpi] | d with c=5000 | d with c=10000 | d with c=20000 | d with c=40000 |
| 1:10 | ~850 | Ø | Ø | 1 | 2 |
| ~425 | Ø | 1 | 2 | 4 | |
| ~200 | 1 | 2 | 4 | 8 | |
| 1:20 | ~850 | Ø | Ø | 0,5 | 1 |
| ~425 | Ø | Ø | 1 | 2 | |
| ~200 | Ø | 1 | 2 | 4 | |
| 1:50 | ~4200 | Ø | Ø | 1 | 2 |
| ~2000 | Ø | 1 | 2 | 4 | |
| ~1000 | 1 | 2 | 4 | 8 | |
| ~500 | 2 | 4 | 8 | 16 | |
| ~250 | 4 | 8 | 16 | 32 | |
| 1:100 | ~4200 | Ø | 1 | 2 | 4 |
| ~2000 | 1 | 2 | 4 | 8 | |
| ~1000 | 2 | 4 | 8 | 16 | |
| ~500 | 4 | 8 | 16 | 32 | |
| ~250 | 8 | 16 | 32 | 64 | |
| 1:200 | ~4200 | 1 | 2 | 4 | 8 |
| ~2000 | 2 | 4 | 8 | 16 | |
| ~1000 | 4 | 8 | 16 | 32 | |
| ~500 | 8 | 16 | 32 | 64 | |
| ~250 | 16 | 32 | 64 | 128 |
It should also be kept in mind that with the gap-filler technique, higher resolutions can be achieved by interpolating the coloration of unmeasured points. This can work optimally on uniform areas but can result in artificial silhouettes and coloring on areas with non-homogeneous features; therefore, it should be new standard to place the Laser Scanner at the necessary distance from the objects to produce the needed resolution, thanks to this case study you will only need to keep our table in hand to achieve your goal.


